|
This article will explain the basics of how to create a map using ArcGIS Online, a cloud-based mapping platform.
- Log into ArcGIS Online: https://augsburgu.maps.arcgis.com
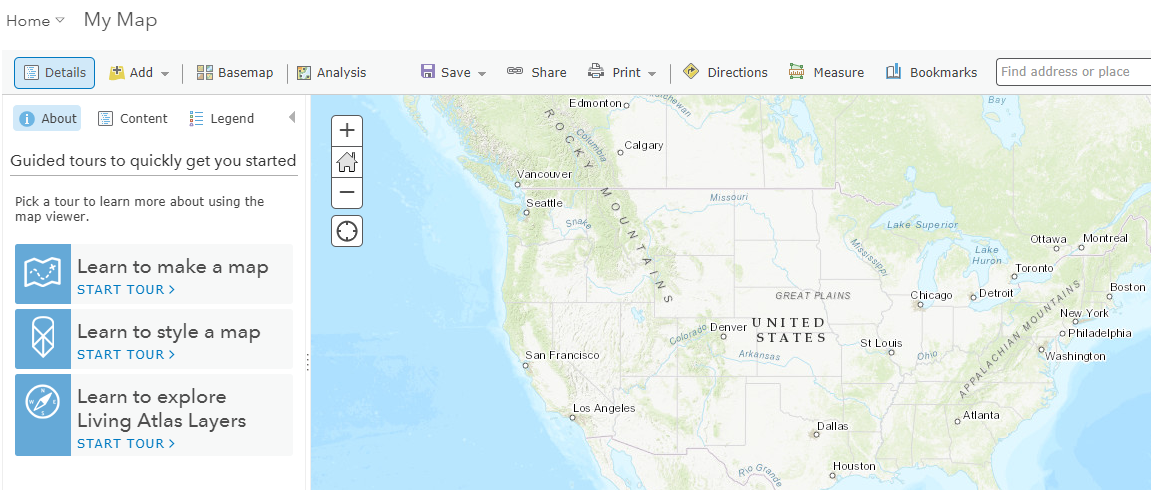
- Select "Map" from the horizontal menu at the top of the page. The My Map page will open. Follow a guided tour, or follow the steps below.

- Zoom in to the level appropriate for the data you wish to display on the map. Click the plus sign (or use keyboard shortcuts such as [Ctrl + +] or [Ctrl + scroll the wheel on your mouse].

- Click Basemap to add a background map Add layers of data via the "Add" button. Try selecting "Browse Living Atlas Layers" to "Add to Map" > "As Layer". You can also select a layer to add as the basemap itself.
Tip: Blog on creating basemaps using layers (create hybrid basemaps by combining multiple layers)
For example, select the "Imagery" Basemap and Add the Living Atlas Layer for the CDC's Vulnerability Index (SVI) - 2014 socioeconomic SVI, census tract level.
- Use the tools under the layer or the More button (three-dots) to change the way the layer looks. For example, change the transparency.

- Select "Analysis" and review the types available. These may take some time to process and will generate an error if the proper data is not available in the map.
Tip: Blog on Spatial Analysis
- Select "Save" > "Save As" to save a new map.
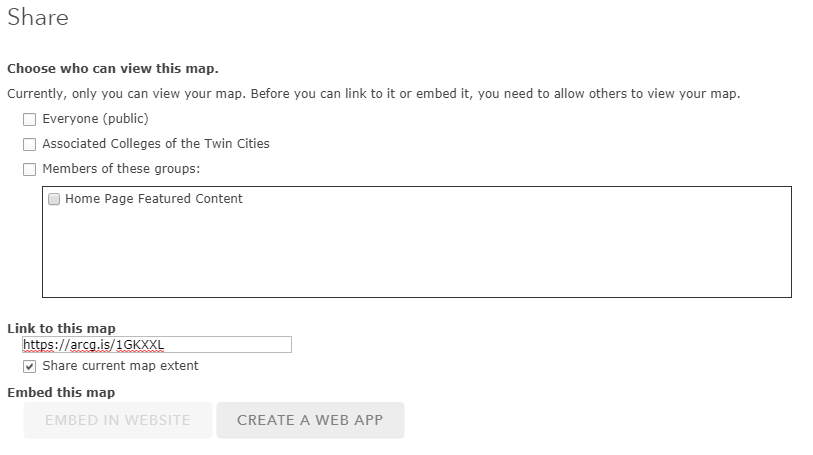
- Select "Share" to select the option for how you would like to share your map. You can make it public for the world to access, only available to the ACTC (Associated Colleges of the Twin Cities) / Augsburg group, copy a link to the map or move to the next iteration by creating a web app (e.g., StoryMap).

- When you want to get back to your map, find maps and other content created in ArcGIS Online under the Content tab on the home page.
Related articles:
http://go.augsburg.edu/arcstorymap
http://go.augsburg.edu/arcomap
Last Modified: 2019/04/18 | 


