|
Your course evaluation results are available on the web for your review. Results are available only after the grade submission deadline has passed for the term. The website URL is available in moodle and will be in emails from the Course Evaluation software.
That URL is
http://eval.augsburg.edu/
Login with your AugNet username and password. If your username or password is not recognized, contact evalhelp@augsburg.edu noting the problem.
- The evaluation reports screen offers several options. The two key areas to check are A and B below. Including all of your courses for a term can result in a very long report that would print out as many many pages. It is often more efficient to view one class per report.
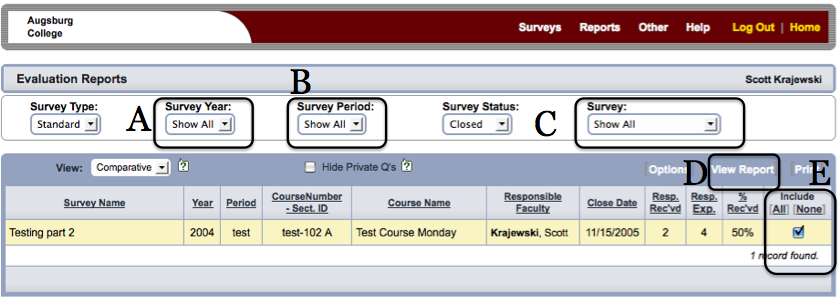
A. Survey Year - Changing this to 'Show All' will show all of your calendar years.
B. Period – Changing this to 'Show All' will show courses in all terms.
C. Survey – Changing this to 'Show All' will show all possible evaluations.
D. View Report – This creates the report in a new window based on the options you have selected.
E. Include – This allows you to select which courses to see in the report.
- There are more options available to you. Click on Options next to View Report to see more options. The defaults are often fine for most people. Many of the options have a little question mark '?' next to them that you can mouse over to see a brief explanation.
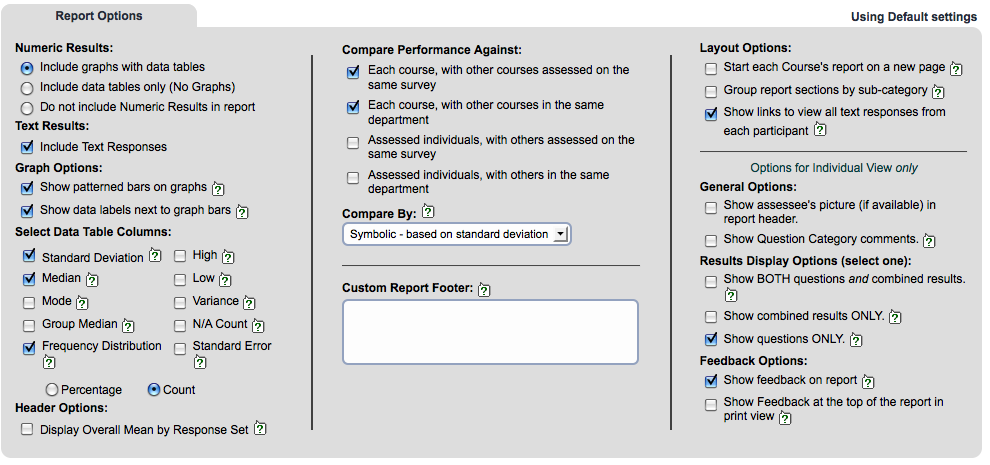
Starting from the upper left and moving down the columns:
• Numeric Results – You may choose to include graphs and numerical data, or to omit the graphs and only have numeric tables, or completely omit the numerical
results. The last option will essentially show only the open-ended responses.
• Text Results – You may choose to omit the open-ended responses.
• Graph Options – You may change how the graphs are shaded and if the graphs will have labels on them.
• Select Data Table Columns – In the numerical results you may chose what statistical elements are included. Generally standard deviation and the frequency
distribution are sufficient. The mean (average) will always be displayed.
• Compare Performance Against – You may choose to not include information comparing this course to others. In some cases the comparisons are not relevant
and only add clutter to the report. The comparisons are only against courses that were open at the same time as this course - i.e. the same term.
• Other Options – These options will generally never be useful to us.
http://go.augsburg.edu/evalreports
Last Modified: 2013/05/14
|